Article Introduction
The original text is in Chinese, and it was translated by www.DeepL.com (free version).Please understand that there are some unsatisfactory words.
The original text can be viewed at https://www.song1118.com.
This article is the third in a series of ThinkPad P15 Gen 2 and P17 Gen 2 comparative reviews, with 6100 words and 50 pictures.
divided into the following chapters.
"Cui Yi Qi Xing“
Square walk
Showing off in all its glory
Seeing the opportunity to act

"Cui Yi Qi Xing“
The word " Cui " means precious stone; "Qi" means beautiful jade, which means rare and beautiful.
The word " Cui Yi Qi Xing " refers to brilliant thinking and unusual behavior.
In the previous laptop review article I have said many times: as a laptop, with a beautiful appearance is of course very rowdy, but after the boot operation, its screen is the first to face the user, which is the real "rowdy" ---- because this is the computer HCI for the user's most important part of the output!

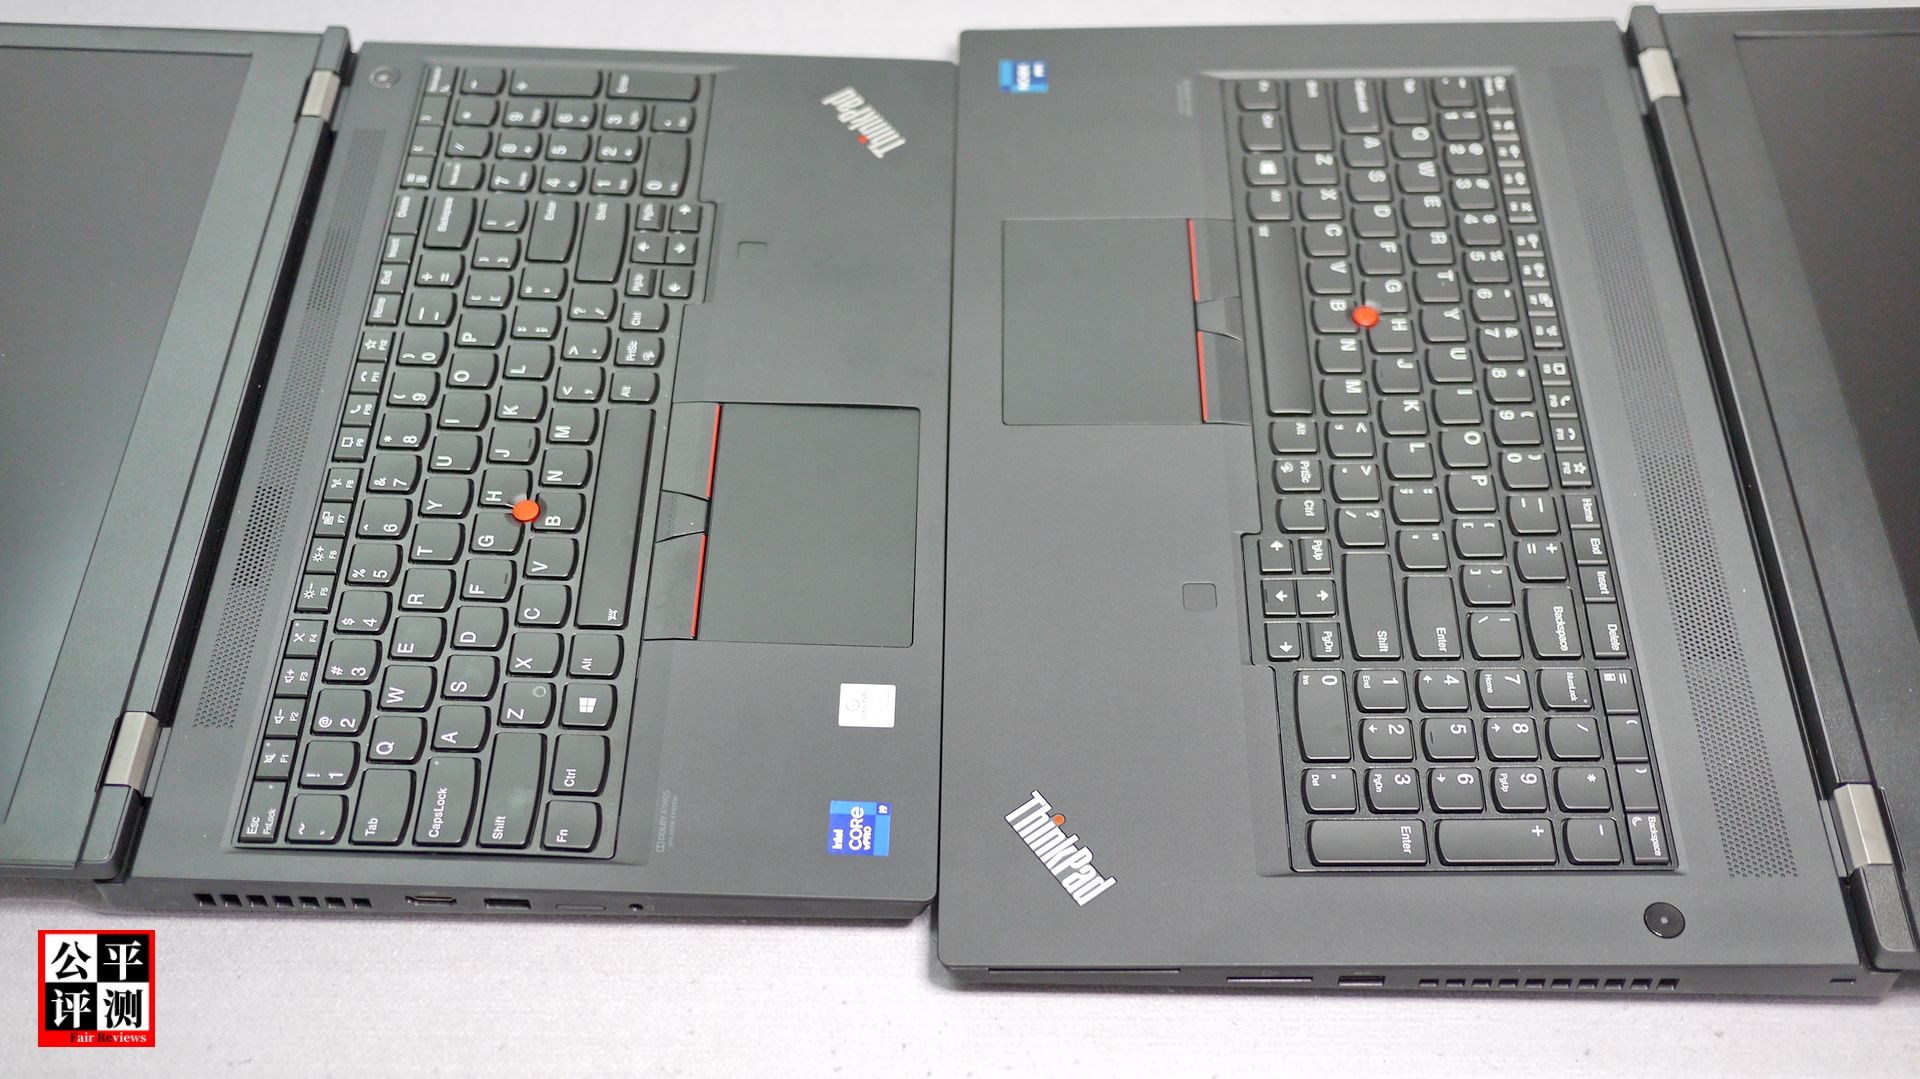
As for the computer human-computer interaction for the user's main input part, of course, is the keyboard and mouse, for ThinkPad, for the current ThinkPad, for the author as a senior ThinkPad user, P15G2 and P17G2 keyboard and mouse, already do not want to say more, in the author's previous ThinkPad notebook review article has I've said enough.
The P15G2 has four officially available 15.6-inch screens: FHD resolution with a brightness of 300 nits and 500 nits each, and UHD resolution with a brightness of 600 nits and 400 nits each. Among them, the UHD resolution brightness of 400 nits is a touch screen, will bring the thickness and weight increase.
I tested this P15G2, the choice is the brightness of the highest 600 nits UHD screen.
P17G2 official optional 17.3-inch screen only two: FHD resolution brightness of 300 nits, UHD respectively rate brightness of 500 nits.
I tested the P17G2, but also naturally did not hesitate to choose the UHD screen.

Use AIDA64 and HWiNFO64 to view the P15G2 screen information, the name is LEN4185, the model ID is MNF601EA1-1, using Windows HD Coloe settings to test and confirm support for HDR.
It should be noted that this P15G2 screen is shipped with Pantone certified color calibration (Pantone) and pre-installed with Aicolor color software (X-Rite Color Assistant), which cannot be used when HDR is enabled.

Using AIDA64 and HWiNFO64 to view the P17G2 screen information, the name is LEN4125, the model ID is NE173QUM-N42, using Windows HD Coloe settings to check and confirm support for HDR.
Similarly, the screen of this P17G2 is also shipped with Pantone certified color calibration (Pantone), and the same pre-installed Aicolor color software (X-Rite Color Assistant).

In the industry's authoritative screen information website screen library (https://www.panelook.com) query, the results are as follows.
This P15G2 using the screen MNF601EA1-1, for China Star Optoelectronics (CSOT) production, 2021 entry information, product code CSO1500, the panel is LTPS TFT-LCD LCD module, using WLED backlight, but the highest brightness marked as 500 nits HDR500, which and the P15G2 officially marked 600 nits HDR400 there are differences, the actual how to be tested below.
The P17G2 uses a screen NE173QUM-N42, produced by BOE, recorded in 2019, the panel is a-Si TFT-LCD LCD module, the use of WLED backlight life of up to 15,000 hours, the maximum brightness of 500 nits HDR400, and the P17G2 official label no difference.

Using Spyder X Elite to measure both screens, and in the measurement, completely excluding the influence of the pre-installed Aicolor color software (X-Rite Color Assistant), the results obtained are as follows.
Color Gamut (Gamut)
The color gamut (Gamut) for LEN4185 used in ThinkPad P15 Gen 2 and LEN4125 used in ThinkPad P17 Gen 2 are as follows.
100% sRGB, 100% sRGB.
99% Adobe RGB, 100% Adobe RGB, a little better for the P17G2.
93% P3, 92% P3, a little better for P15G2.
95% NTSC, 94% NTSC, a little better for the P15G2.
Among the results of Adobe RGB, P15G2 is 99%, lower than the official claim of 100%, do not rule out the lack of precision of the instrument used by the author, or measurement errors caused; P17G2 is 100%, in line with the official claim.
The other three values of the two are basically the same, there is a difference of only 1%, and are close to or already 100%, satisfactory.

Brightness and Contrast (Brightness and Contrast).
The brightness and contrast of the two are as follows.
P15G2 brightness maximum of 582.5 nits, lower than the official nominal 600 nits, but the absolute value is a high brightness.
the maximum brightness of the P17G2 is 470.7 nits, which is lower than the official nominal 500 nits, and the absolute value also belongs to high brightness.
P15G2 measured contrast ratio at maximum brightness of 1320:1, higher than the official nominal 1200:1, which is good.
P17G2 measured contrast ratio at maximum brightness of 1140:1, higher than the official nominal 1000:1, good.
The above measured brightness and contrast ratio, although the brightness does not reach the official nominal, but still belongs to the current excellent screen.
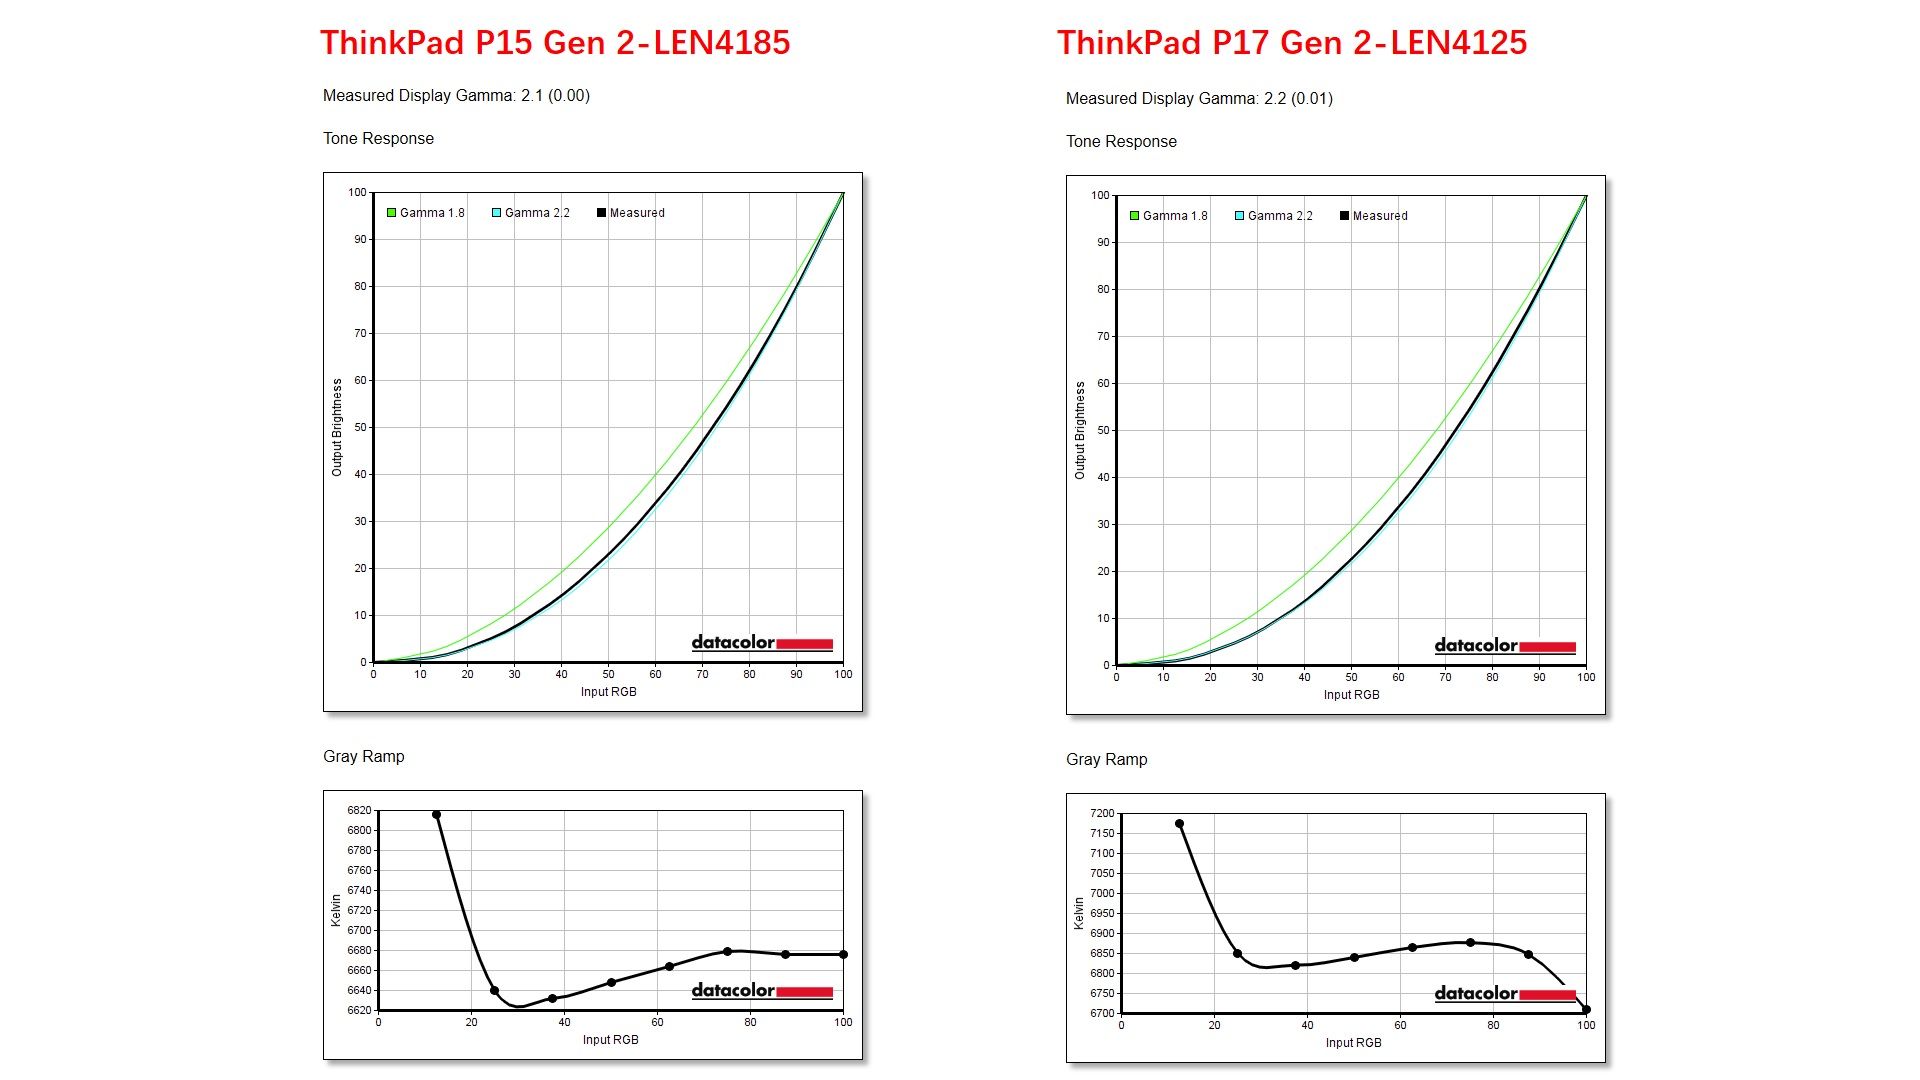
Tone Response (Tone Response).
P15G2 Tone Response curve and display gamma (display luminosity) 2.1 almost exactly repeated, very good.
P17G2 Tone Response curve is slightly worse, and the display gamma (display luminosity) 2.2 has a deviation of 0.01, very good.
P15G2 gray scale in the range of 20 to 80% with a very small difference between 6690 and 6620 Kelvin.
The P17G2 has a very small difference in grayscale in the range of 20 to 80%, between 6950 and 6800 Kelvin.
Screen Uniformity (Screen Uniformity).
Color Uniformity (Color Uniformity).
The P15G2 has the highest Delta E value of 5.7 at the highest brightness, with the highest brightness in the middle right and the darkest in the upper center.
The highest Delta E value of 6.6 for the P17G2 at the highest brightness, with the highest brightness in the upper right and the darkest in the lower left and lower center.
Overall, the color uniformity of both screens is not bad, but the P15G2 is slightly better than the P17G2.

Luminance Uniformity for Brightness
P15G2 at the highest brightness, the maximum difference in brightness value of 6% occurs, with the upper left and upper center brightest and the right center darkest.
P17G2 at the highest brightness, the maximum difference value of the luminance that appears is 20%, the upper left and upper right is the brightest, the lower right is the darkest.
Overall, the brightness uniformity of the screen of this P15G2 is relatively good, while the brightness uniformity of the screen of this P17G2 is average.

Color Accuracy.
The Delta E value of the P15G2, which has a maximum value of 2.03 at 2D and a mean value of 0.54, is excellent.
Delta E value of P17G2, with a maximum value of 2.34 and a mean value of 1.14 in 3D, is not as good as that of P15G2, but it is also excellent.

Overall rating (Monitor Rating).
Finally, according to the evaluation criteria of Spyder X Elite, the following comprehensive evaluation was given to both screens.
The color gamut and tonal response of the P17G2, which is better than that of the P15G2.
Color uniformity and brightness uniformity of the P15G2, better than the P17G2.
All other aspects are in between, and the final overall rating of both is 4 stars, which is an excellent screen.

From the above actual test data, the P15G2 and P17G2 screens, its overall display effect belongs to the excellent, the color gamut, contrast and color accuracy of both, is worthy of praise.
The P15G2 has a maximum brightness of nearly 600 nits and a contrast ratio of up to 1320 ratio:1, while the P17G2 has a maximum brightness of nearly 500 nits and a contrast ratio of up to 1140 ratio:1. Both have passed HDR400 certification and support Dolby Vision High Dynamic Display, so the display of both screens can ensure normal user use in bright outdoor areas and under sunlight.
Both have UHD resolution and can display the same content. The P15G2 has a slightly higher picture fineness due to its 15.6-inch screen size, which is smaller than the P17G2's 17.3 inches.
But the P17G2 screen size is larger, in the viewing comfort is better than the P15G2, the size is larger, in the brightness and uniformity of the improvement, really not as easy as the smaller size of the screen, excluding in the brightness uniformity of the poor performance, this P17G2 screen, in other aspects are very good.
The above test results prove that both can fully meet the needs of creative design users ---- that is, the beginning of this section of the literal meaning of "Cui Yi Qi Xing": as creative design users think "Cui Yi", can be obtained on the screen "QiXing".
For the orthodox mobile workstation users, the above two screens are also excellent choices.
For game users, because both screens are 60 Hz refresh rate, plus the ultra-low cost of professional graphics cards, as a mobile workstation ThinkPad P series, I believe that are naturally not the first choice for game users.
However, as a mobile workstation ThinkPad P series, must play games, and other orthodox gaming book (gaming book) comparison, in performance and functionality, generally do not fall behind, and in other areas there is a plus.
If you do not believe, please see below.

Square walk
It refers to walking at a square pace, indicating that the behavior is in line with the norms of etiquette.
I always pursue the testing of digital products in great detail, so the P15G2 and P17G2 pre-installed systems, drivers and pre-installed software situation, will not be missed ---- I think this is due to the review of etiquette norms, is the respect for each product.
P15G2 pre-installed system is the English Windows 10 Professional Edition, P17G2 is the English Windows 10 Mobile Workstation Edition, the two functions may have small differences, performance play according to Microsoft is the same.
After the P15G2 first boot, the memory occupancy is 4% due to the total memory of 128GB, which means it occupies 4.8GB, and the pre-installed software and drivers are 13, occupying 342MB of hard disk space.

P15G2 after the first boot, the use of LatencyMon on the driver latency detection, the results show a long red font, even prompting the need to check the BIOS settings, whether there is a BIOS update, which indicates that the P15G2 factory pre-installed driver latency overall poor performance.

The author is naturally a number of updates to get improved:

the P17G2 after the first boot, also due to the total memory of 128GB, memory occupancy of 4%, that is, occupy 5.1GB ---- Why than the above P15G2 to occupy 0.3GB more? This reason is explained in the graphics card test session and is skipped here for now. Its pre-installed software and drivers are 7, occupying 180MB of hard disk space.
Also checked its BIOS version, released on July 29, version 1.13.

The same is the first time to start Lenovo Vantage to check whether there is an update ---- Note that the models sold in China, generally will not be pre-installed Lenovo Vantage, but completely localized "Lenovo Computer Manager", the two have their own target users, as to which one is better, the author will I do not want to say more.
The result of the check is three updates, respectively, BIOS, VBIOS and Intelligent Thermal Solution (Intelligent Thermal Solution), of which the BIOS and VBIOS two updates, you need to reboot the system to complete.
Update the BIOS to version 1.15, update the entire process of VBIOS, I have shot a video recording of the entire process, interested and time can click the following link to watch:.

Update the BIOS to version 1.15, update the entire process of VBIOS, I have shot a video recording of the entire process, interested and time to click on the following link to watch.
https://www.zhihu.com/zvideo/1444737942275682304
After completing all the updates (including the Windows 10 update), using LatencyMon to detect the driver latency, after running for up to 27 minutes, it is still all green fonts, which shows the excellent overall strength of the official hardware software firmware, but also can understand the good intention of the official continuous updating.

Showing off in all its glory
The clothes embroidery day walk refers to wearing embroidered clothes in the daytime walk. It is generally used as a metaphor for being an official in your hometown or returning to your hometown after being rich and famous.
I review the P15G2 and P17G2, both of which are available top of the line at the moment.
P15G2 is the Core Edition top of the line, with intel Core i9-11950H + NVIDIA RTX A5000 + 128GB of memory.
P17G2 is the top of the range version, with intel Core W-11955M + NVIDIA RTX A5000 + 128GB ECC memory.
So, with such a luxurious configuration, not seriously review some and then publish an article out, it is really a night out ......
But the author's habit is: whether it is silk or cotton, whether it is day or night, should come out and walk, is said to be the day walk a hundred miles, great ...... so, clothes embroidery day walk.
CPU
This P15G2 tested, the CPU is its optional top-of-the-line intel Core i9-11950H. using AIDA64, CPU-Z and HWiNFO64 to view information, the third level of cache is 24MB, 8 cores and 16 threads, the basic frequency of 2.6GHz, accelerated frequency up to 5.0GHz, while with UHD integrated graphics.

The test P17G2, the CPU is the most powerful Intel W-11955M, using AIDA64, HWiNFO64 and CPU-Z to view information, the same third level cache of 24MB, 8 cores and 16 threads, the basic frequency of 2.6GHz, accelerated frequency up to 5.0GHz, also with UHD integrated graphics card.

In short, the various high-end values of both CPUs are really pleasing to the eye.
In addition, HWiNFO64 shows the names of the two models, ThinkPad P15 Gen 2i and ThinkPad P17 Gen 2i ---- have an extra letter "i" at the end of the official name, which is based on the intel platform, indicating that, in addition to the already existing ThinkPad P14s Gen 1 and 2 (AMD), the possibility of an official P series flagship based on the AMD platform cannot be ruled out.
Cinebench Benchmarks
In the Cinebench R15, R20 and R23 benchmark performance tests, the i9-11950H on top of this P15G2 scored as follows.
R15 multi-core score and single-core score of 2183 and 245, respectively.
R20 multi-core score and single-core score of 5316 and 630, respectively.
R23 multi-core score and single-core score are 13578 and 1629 respectively.

And the scores of W-11955W on top of this P17G2 are as follows.
R15 multi-core score, single-core score of 2220 and 249 ---- are a little higher than the P15G2.
R20 multicore score and single core score are 5119 and 631 respectively ---- multicore is lower than P15G2, single core is 1 point higher ......
R23 multi-core score, single-core score of 13,682 and 1633 ---- are higher than the P15G2 a little;;.

Both of the above scores, and the author's history of actual test models compared, the results are as follows.
1. P17G2 is slightly higher than the score of i9-11950H on the same generation competitor DELL Precision 7760;
2. P15G2 and P17G2 compared to each other, the score is significantly higher than the same generation of competitor DELL Precision 7560.
3. Both, along with the 7760, are inferior to the score of the i9-11900H on the ASUS ROG S17 GX703 in the overclocked state.

Cinebench R15 Multi Loop
In the Cinebench R15 Multi Loop test, which tests the stability of the CPU over long periods of time and under high load, the multi-core scores of the P15G2 and P17G2 are as follows.
Peaks of 2190.82 and 2193.22, respectively.
Means of 1763.50 and 2049.21, respectively.
The trough values are 1371.18 and 2010.45 respectively.
P15G2 performs significantly worse than P17G2 at this point, with a mean value nearly 16.2% lower.

In the score curve comparison chart can also be seen, the P15G2 score red curve, after the 10th test, cliff fall began to violently oscillate, after the curve is jagged know the end of the test.
The white curve of the P17G2's score is much better, and although there are ups and downs after the 10th test, the overall fluctuation is small and remains above the 2010 score from the beginning to the end.
Ultimately, the P17G2's curve was at the top of the list at the initial stage, but after 21 tests, it was surpassed by the ASUS ROG S17 GX703's i9-11950H which was in an overclocked state.
And while the P15G2 started well, it fell off a cliff after the 10th test, resulting in a severely pulled down average that ended up lower than its contender DELL Precision 7560 and 7760, slightly higher than the previous generation P15 Gen 1, about 3% higher than the HP ZBook Power G8, and about 17% higher than the P15v.
This indicates that the i9-11950H on top of this P15G2 is playing average, and the average Cinebench R15 Multi Loop is nearly 14% less when compared to the P17G2 ---- This is a value that is hard to ignore.
This will be explained in detail in the Stress Tests section of serial 4.
3DMark CPU Profile
The results of the P15G2 and P17G2 tests using the 3DMark CPU Profile are as follows.
Maximum threads of 7473 and 7382 respectively.
16 threads of 7396 and 7363 respectively.
Single-threaded 971 and 995 respectively.

The reason is that the 3DMark CPU Profile benchmark test does not need to run continuously for a long time, so the P15G2 has no problem with its performance at the time of the starting burst and sprint race.
GPU
Both the P15G2 and the P17G2 were tested with the optional top-of-the-line NVIDIA RTX A5000 Laptop GPU. According to the official specifications, when using the T1200 or A2000, the graphics TGP is 60 watts, but when using the A3000, A4000 and A5000, the graphics TGP varies: the P15G2 is 90 watts, and the P17G2 is 25 watts higher at 115 watts.

In addition, both are dual graphics models, inside the BIOS settings, under Display ----Total Graphics memory (Display ----Total Graphics), can be optionally set to 256MB or 512MB, which is the setting to convert the memory to the graphics memory used by the Intel integrated graphics card, the factory default is 256MB, when manually set to 512MB only, the The available memory under the operating system will be reduced by 256MB accordingly, which is the reason why the P17G2, above, takes up 0.3GB more memory than the P15G2.

Using GPU-Z and NIVIDA control panel to view information about the graphics card of this P15G2, the system information of NIVIDA control panel, shows that the maximum power of the graphics card is 110 watts, which is the effect of its support for Dynamic Boost 2.0 (Dynamic Boost 2.0).
Other parameters are, 6144 CUDA, the base frequency of 1455MHz, memory data rate of 12Gbps, 256-bit 16GB GDDR6 memory, 384.06GB/s bandwidth, support for the third generation of Max-Q technology, silent mode (WhisperMode ) 2.0, and I think the most critical use of PCIe 4.0 x 16 bus.

Using GPU-Z and NIVIDA control panel, check the information about the graphics card of this P17G2, NIVIDA control panel system information, showing the maximum power of the graphics card is 135 watts, also higher than the P15G2 25 watts ----- can be seen in both Dynamic Boost 2.0 (Dynamic Boost 2.0) to bring the effect, theoretically, both up to 20 Theoretically, both can be boosted by up to 20 watts.
Other parameters, the same number of CUDA, the same 256-bit 16GB GDDR6 memory, support for WhisperMode 2.0, the use of the PCIe 4.0 x 16 bus.
However, compared to the P15G2, there are other differences besides the power of the card: the base frequency is increased to 1575Hz, the memory data rate is 14Gbps, the bandwidth is 448.06GB/s, and Max-Q technology is not supported.

3DMark
Using 3DMark benchmarking software, the two were tested in mixed graphics mode and discrete graphics mode, plus a second mid-range P17G2 (i7-11800H + A4000) in discrete graphics mode, and the author's history of actual model scores for comparison, the results are as follows

The closest configuration of DELL Precision 7760 (Intel Core i9-11950H + RTX A5000-DDR4-3200-128GB ECC) discrete graphics mode total score for comparison, is the following state.
The total score of the P15G2 discrete graphics mode, which is 92.89% of the 7760.
The total score of the P17G2 Mid (i7-11800H+A4000) discrete graphics mode, is 89.67% of 7760.
Total score for the P17G2 discrete graphics mode, 101.89% of the 7760.
the total score of DELL Precision 7560 (i9-11950H+RTX 3080) discrete graphics mode, which is 92.80% of 7760.
The highest score, for the overclocked state of ASUS ROG Iceblade 5 Plus ( Core i9-11900H+RTX 3080), was 113.58% of the 7760.
As you can see, the total score of P15G2 is slightly higher than 7560, and I think it will be even higher if it is replaced by T15g Gen 2 with RTX 3080 graphics card;.
the total score of P17G2 is 1.89% higher than that of 7760.
In addition, the total score of 7760 with 32GB DDR4-3466MHz memory is 101.27% of 7760 with DDR4-3200-128GB ECC memory, still a little lower than P17G2.
The lowest is the mid-range version of the P17G2, because its graphics card is RTX A4000, justifiable, but not too far from the P15G2 using A5000 graphics card, the difference is about 3%.
Port Royal
In the 3D Mark Port Royal test, which in theory completely excludes CPU influence, a subtle change occurred.

Again, using the score of the DELL Precision 7760 discrete graphics mode, which is the closest configuration, for comparison, is the following state.
P15G2 discrete graphics mode score, 90.98% of the 7760.
The total score of the P17G2 Mid Edition (i7-11800H+A4000) discrete graphics mode, which is 89.78% of the 7760.
Total score for the P17G2 discrete graphics mode, 99.95 per cent of the 7760.
the total score of DELL Precision 7560 (i9-11950H+RTX 3080) discrete graphics mode, which is 90.84% of 7760.
The highest score, for the overclocked state of ASUS ROG Iceblade 5 Plus (Core i9-11900H+RTX 3080), was 115.24% of the 7760.
The P15G2 still scores slightly higher than the 7560.
The P17G2 scored 0.05% lower than the 7760 in total - a reversal of the 7760
the total score of the 7760 with 32GB DDR4-3466MHz memory is 102.93% of the 7760 with DDR4-3200-128GB ECC memory, which is 2.98% higher than the P17G2 - again, the 7760 reverses.
This seems to be caused by the fact that the P17G2's graphics card performance is slightly lower than that of the 7760 when CPU performance is excluded.
The lowest is the mid-range version of the P17G2, which is not too far from the P15G2 with the A5000 graphics card, with a difference of about 1.2%.
SPECgpcViewperf 13
Using the professional graphics performance testing software SPECgpcViewperf 13 for benchmarking, the scores of the P15G2 and P17G2 were compared with other models as follows.

Again with the closest configuration DELL Precision 7760 discrete graphics mode scores are compared to the benchmark and are the following states.
P15G2 discrete graphics mode score, 91.04% of the 7760.
The total score of the P17G2 Mid-range (i7-11800H+A4000) discrete graphics mode, which is 89.07% of the 7760.
The total score of the P17G2 discrete graphics mode, 100.12% of the 7760 ----P17G2 is a little bit better, but it can be said to be exactly the same.
Then, the advantages of professional graphics cards are fully reflected: the
The total score of the DELL Precision 7560 (i9-11950H + RTX 3080) in discrete graphics mode, only 52.46% of the 7760.
The total score of the ASUS ROG Iceblade 5 Plus (Core i9-11900H+RTX 3080), which has been the highest scorer above, in overclocked state, is only 56.22% of the 7760.
In terms of memory, the advantage of DDR4-3466HMz, the manifestation is limited: the
The total score of 7760 with 32GB DDR4-3466MHz memory is 100.65% of 7760 with DDR4-3200-128GB ECC memory, which is 0.53% higher than P17G2.
The advantage of generation difference is also reflected in the following.
114.25% for the P15G2 over the P15G1.
7760 is 122.09% of 7750.
SPECgpcViewperf 2020
Using SPECgpcViewperf 2020 v2.0 for benchmarking software, the scores of the P15G2 and P17G2 compared to other models are as follows.

Again with the closest configuration DELL Precision 7760 discrete graphics mode scores are compared to the following states.
P15G2 discrete graphics mode score, 88.43% of the 7760.
The total score of the P17G2 Mid-range (i7-11800H+A4000) discrete graphics mode, which is 87.60% of the 7760.
The total score of the P17G2 discrete graphics mode is 101.74% of the 7760.
Again, the advantages of professional graphics cards are fully reflected: the
The total score of the DELL Precision 7560 (i9-11950H + RTX 3080) discrete graphics mode, only 55.77% of the 7760.
The total score of the ASUS ROG Iceblade 5 Plus (Core i9-11900H+RTX 3080) in overclocked state is only 59.53% of that of the 7760.
In terms of memory, the advantages of DDR4-3466HMz, not reflected in.
The total score of the 7760 with 32GB DDR4-3466MHz memory is 100.67% of the 7760 with DDR4-3200-128GB ECC memory, which is instead 1.07% lower than the P17G2.
The advantage of generation difference is also reflected in the following.
113.80 percent for the P15G2 over the P15G1.
7760 is 119.20% of 7750.

Through the above general and professional graphics performance tests and comparisons, it can be seen that.
1. the generation difference advantage is obvious, the general graphics performance of the new generation of RTX A5000, compared to the previous generation of RTX 5000 has about 25% improvement, professional performance has about 18% improvement.
2. In the case of 128GB DDR4-3200 memory, the general graphics performance of the P17G2, P15G2 and 7760 scores about 101:91:100, and the professional graphics performance score ratio is also about 101:91:100.
3. taking into account the impact of measurement errors, CPU performance play, plus the erasure of zero words, I believe that the P17G2, P15G2 and 7760 comprehensive graphics performance comparison, should be 100:90:100.
4. as for the 7560, although its use of power is 180 watts power supply, less than the P15G2 230 watts, but the maximum power consumption of its graphics card and P15G 2 the same 110 watts, so its comprehensive graphics performance and P15G2 is difficult to distinguish.
5. As for the 7760 support DDR4-3466 memory features, according to the theory under the ideal state, I believe that its general graphics performance can be improved by about 2%, professional graphics performance can be improved by about 1%, the price paid compared to the results, the significance is very limited.
Storage
Memory
The memory of the P15G2 and P17G2 tested in this test, both in the current fully loaded state, are installed with four 32GB DDR4-3200 MHz memory, the difference is that the CPU of the P17G2 is a Xeon processor that supports ECC memory, and the memory installed supports ECC.
Both use the cache and memory benchmarking modules of AIDA64, and the test results are as follows.

Differences in cache performance between the two CPUs, but negligible.
The read, write and copyability of the memory of both also differ. The latency (Latency) of the P17G2 ECC memory is slightly higher and routine.
Hard disk
One of the most obvious upgrades between the P15G2 and P17G2 compared to their predecessors is the addition of a new PCIe 4.0 SSD slot under the keyboard, thus enabling three M.2 SSDs to be built in at the same time.
In addition, there is a M.2 3042 slot for WWAN card, and I installed a M.2 2242 NVMe SSD in this position in the P15G2 as usual.

As a result, the 1802 error message appeared on the boot, and it could not continue to boot only then automatically shut down.
From this to the P17G2 I also gave up the same test, after all, both common motherboard, BIOS is also the latest version of 1.5.1, the results should be the same.
For such a result, I am very dissatisfied, after all, the same generation ThinkPad P14s, P15s and P15v, can be installed in the WWAN slot SSD normal use, even if the P15G2 and P17G2 already have three M.2 SSD slot, but the WWAN slot vacant can not M.2 SSD, thus can not achieve the built-in four M.2 SSD, inevitably also A bit cheap.

The P15G2 and P17G2 tested were not factory preset with intel VMD drive mode on, so the CrystalDiskInfo test correctly displayed the respective transfer modes.
When the number of hard drives is met, the intel VMD hard drive mode is turned on, according to the official information, only RAID 0 and 1 can be formed, and RAID 5 is not supported.
When the Western Digital SN850 2TB SSD with PCIe 4.0 support is installed in the main PCIe 4.0 supported slot position under the keyboard, the test results are as follows, with a score of 8056 from AS SSD Benchmark.

When the Western Digital SN850 2TB SSD with PCIe 4.0 support is installed in the D-side slot that does not support PCIe 4.0, the test results are as follows, and the AS SSD Benchmark score drops to 7445.

When installing a Samsung 980Pro 2TB SSD with PCIe 4.0 support in a D-side slot that does not support PCIe 4.0, the test results are as follows, with an AS SSD Benchmark score of 7157.

Using PCMark 10's Full System Drive benchmark test, the Western Digital SN850 2TB SSD installed in the main slot position that supports PCIe 4.0, and the Western Digital SN850 2TB SSD installed in the D-side slot position that does not support PCIe 4.0, were tested separately, resulting in a significant difference in scores between the two.
The score for those supporting PCIe 4.0 was 2825.
The unsupported one scored 2236, with a difference of 26.34%.

SD card reader
P15G2 and P17G2's full-size SD card reader is located on the front right side of the body, full storage design, do not worry about SD out.
The SD card reader is from Genesys Logic and uses PCIe 2.0 x1 to connect to the PCH.

A 32GB Lexar 2000x SD card and an 1800x microSD with the original micro-SD to SD card holder were installed and tested using ATTO Disk Benchmark with the following results.

The results were measured with the Lexar 2000x SD card:
A peak read rate of 87MB/s, much lower than the 271MB/s of the same card in the Realtek reader on the 7760.
A peak write rate of 90MB/s, much lower than the 252MB/s of the Realtek reader on the same card in the 7760.
Read and write IO/s scores, again lower than the same card on the 7760 with the Realtek reader.
Using the Lexar 1800x microSD plus the original micro-SD to SD card, the results were:
A peak read rate of 184MB/s, significantly lower than the 256MB/s of the same card on the 7760 with the Realtek reader.
Write rate peaks at 254MB/s, reversed, higher than the 206MB/s of the Realtek reader on the same card in the 7760.
Read and write IO/s scores, also reversed, better than the same card on the 7760 on Realtek readers.

I started with the P15G2 SD card read and write test, I think the above results are unlikely, because there is a small circuit board for the P15G2 to place the SD card reader disassembly, thought the installation was not in place, so again disassembled the small circuit board for reinstallation, the results remain the same.

Then, the first P17G2 and the second P17G2 borrowed for testing arrived one after another, after the same test on the two P17G2, the results were similar.
Finally, I used the original Lexar USB-A 3.0 SD card reader with a Lexar 2000x SD card installed and connected to the right USB-A port of the P17G2 to perform the same test, and the results were as follows.

A huge increase in peak read rate compared to when the SD card reader was in place, reaching 247MB/s, slightly lower than the 271MB/s of the Realtek card reader on the same card in the 7760.
The peak write rate is also tremendously improved, reaching 269MB/s, surpassing the 252MB/s of the same card in the Realtek reader on the 7760.
Read and write IO/s scores, also improved, but still slightly lower than the same card in the 7760 on the Realtek reader.

According to the above SD card reader actual test results, I believe that.
P15G2 and P17G2 using Genesys Logic PCIe SD card reader, its performance and compatibility, is significantly inferior to the 7760 on Realtek SD PCIe card reader, of course, can not be ruled out is the use of its small circuit board and the motherboard separated by the design.
The above test results of CPU, GPU and storage.
To sum up is that
1. P15G2's CPU performance is average, lower than 7760, peak higher than 7560 but the average value is lower than 7560.
2. P17G2 performance is significantly better and more stable than the 7760.
3. the GPU performance of the P15G2, P17G2, 7560 and 7760 play with each other, 90:100:90:100.
4. The four in the storage part of the comparison, it is more intricate: the
a. In terms of memory, both the 7560 and 7760 support DDR4-3466MHz, which does bring some performance improvement in some places, but the improvement is very limited, and the price is higher.
b. As the 7560 has only three built-in M.2 SSD slots, it is the same as the P15G2.
c. Because the 7760 has four built-in M.2 SSD slots, there are more than the P17G2, making the DELL Precision 17-inch model significantly different in functionality compared to the 15-inch model.
d. The same hard drive, on the P17G2 without intel VMD mode on, seems to have slightly higher performance than on the 7760 with intel VMD mode on.
e. In terms of SD card readers, the DELL Precision 7560 and 7760, both of which use Realtek SD PCIe readers, have significantly better performance and compatibility than the Genesys Logic PCIe SD card readers used in the P15G2 and P17G2.
Also, it can be confirmed that.
no differences in storage between the P15G2 and P17G2.
the existence of differences in the graphics card TGP is not false, and there is a significant gap between the graphics performance of the two.
In terms of CPU, the P15G2, which has a smaller body, is less stable than the P17G2 in terms of performance.
But, who is better and who is worse?
P15G2 body size and weight is smaller than P17G2, which is an advantage.
The performance of P15G2 is not as good as P17G2, but the battery capacity is the same, and the battery life seems to be an advantage?
The P15G2 screen size is smaller than the P17G2, but the brightness is higher, the user viewing comfort, is it an advantage or disadvantage?
In short, P15G2 and P17G2, the two wings, the author is still difficult to choose.

See the opportunity to act
See the opportunity to act originally means to see the specific circumstances of the flexible work.
But I currently see the "machine" is too much, the face of DELL Precision 7560, 7760 and ThinkPad P15G2 and P17G2 these four models, five machines (P17G2 has two), after months of continuous testing, there are many complicated test data, a relatively arduous statistical analysis, and finally adopted a flexible approach, that is.
7560 review article has long been released irrevocable, the 7760 review and P15G2 & P17G2 comparison review, using a parallel and alternating serial way, issued in turn, so as not to delay the advancement of their respective content, but also not to cause reading duplication, but also to avoid the length of the article is too long.

So far, the text of "P15 Gen 2 & P17 Gen 2 Comparison Review Part 3" has exceeded 8,000 words and nearly 40 pictures, in accordance with the usual serial 3 end, the next Part 4 ---- is "DELL Precision 7760 Review Part 4".
After "DELL Precision 7760 Review Part 4", it is "P15 Gen 2 & P17 Gen 2 Comparison Review Part 4".
Stay tuned!
Post your Opinion