UserBenchmark
UserBenchmark is an online benchmarking software that can be used for free without registration, and any user's test results will enter its official website database and provide users with open query comparison.
Using UserBenchmark, the P16G1-DG-A, DG-B, and DG-C were tested as follows:
Gaming scores: 140%, 134% and 142%, all UFO level;
Desktop scores: 111%, 109% and 111%, all UFO level;
Workstation scores: 147%, 147%, and 161%, all UFO-level.
At the same time, you can see the performance evaluation of 2x32GB, 4x16GB and 4x32GB memory, which is 141%, 136% and 126% respectively.

PassMark PerformanceTest
PassMark PerformanceTest is a paid software, if you do not pay, there is a time limit, the test results can be uploaded to the official online database, and the existing data can be downloaded for comparison, the author tested P16G1-DG-A, DG-B and DG-C.
PassMark Performance Test CPU Mark test
The scores were 35408, 35708 and 36852, respectively.
Among them, 36852 is the highest of the 14 scores, compared with the CPU performance single test in the article in the article, the score of i16G1 above the i9-12900HX has changed from high to equal to i9-12950XH on HP ZBook Fury 16 G9---- it seems that something bad has happened...

PassMark Performance Test 2D Graphics Mark test
The 2021 Dell flagship 7760 has the highest 2D score at 1309;
P17G2 and P15G2 both score 1200+;
The P16G1 scored 1101, 1071 and 1044 in order, and was at the bottom of the 14 scores. It doesn't feel good...

PassMark Performance Test 3D Graphics Mark test
The scores of the three are 21734, 21074 and 20814, all higher than P1G5 and F16G9, which are good.

PassMark Performance Test Memory Mark Test
The scores of the three are 3301, 3322 and 3158, which is the upper middle level among the 14 results.
Slightly better than the HP ZBook Fury 16 G9, but not as good as the P1G5.

PassMark Performance Test Disk Mark Test
The scores of the three are 32167, 31832 and 31453, which is not much different and meets expectations.
THE BEST SCORE IS THE DELL 7670, AT 51359, BECAUSE IT USES THE SAMSUNG PM9A1 2TB, WHICH SEEMS TO BE ENABLED SAMSUNG'S MAGIC SOFTWARE TO BRING ABOUT SSD ACCELERATION SCORES.

Based on the final score given by PassMark Performance Test above:
The final ratings of the P16G1, which were 8831, 8609 and 8614, did not enter the PassMark Rating of 9000.
Not as high as HP ZBook Fury 16 G9 with a maximum score of 9088;
Not as good as the P1G5's 9087;
Not as good as DELL Precision 7770's 8914;

Why is the final score of the P16G1 so low in the PassMark Performance Test benchmark?
Why is it at the top of the list in the novella, but it is so in PassMark?
In the three combined performance benchmarks of SPECworkstation 3.10, UL Procyon and UserBenchmark above, P16G1 also ranked first, but why does PCMark 10, like PassMark, express poor performance of P16G9?
The previous theoretical analysis can no longer be completely consistent with the actual measurement results, and in order to get the answer, further in-depth testing is needed to find the truth.
So, start the pressure test of P16G1---- commonly known as "copying machine", pay attention! It is not a "roaster", it is a "roast" of torture, not a "roast" of roasted chicken.
Pressure: Walking on thin ice
3DMark Stress Tests
Since I received P16G1 on November 8, I have used 3DMark Stress Tests to stress test P16G1 several times for nearly a month, and the room temperature was about 15 degrees Celsius, and the results are as follows:
The Time Spy Stress Test was conducted 4 times, and the stability is:
1st on November 15: 92.4%, not adopted;
2nd on 15 November: 92.7%, not adopted;
3rd on 22 November: 92.1%, not adopted;
4th on November 25: 98.8%, successfully passed.
The reason for the last pass is that the author upgraded the BIOS/EC of P16G1 to the latest version of 1.15/1.06.

The Fire Strike Stress Test was carried out 3 times, and the stability is:
1st on November 15: 96.5%, almost passed;
11st on November 22: 2.92%, not adopted;
3rd on December 7: 96.0%, still not passed.

The HP ZBook Fury 16 G9 tested by the author is a one-time pass, with a stability of 98.7%, which shows that the graphics performance of P16G1 is significantly less stable than that of F16G9 under this stress test.
Of course, you can also see that there is a significant difference in the operating frequency of the GPU RTX A5500 of the two, P16G1 is 1852~1905MHz, and F16G9 is much lower, 1372MHz---- which is why the graphics performance of P16G1 is significantly higher than that of F16G9.
The Speed Way Stress Test was carried out 3 times, and the stability is:
11st on November 15: 1.93%, not adopted;
11st on November 22: 2.92%, not adopted;
3rd on December 7: 92.2%, still not passed.

The HP ZBook Fury 16 G9 tested by the author is a one-time pass, with a stability of 97.5%, which shows that the graphics performance of P16G1 is also significantly less stable than that of F16G9 under this stress test.
Similarly, the P16G1's GPU RTX A5500 both run at 1905MHz, while the F16G9 only has 1710MHZ.
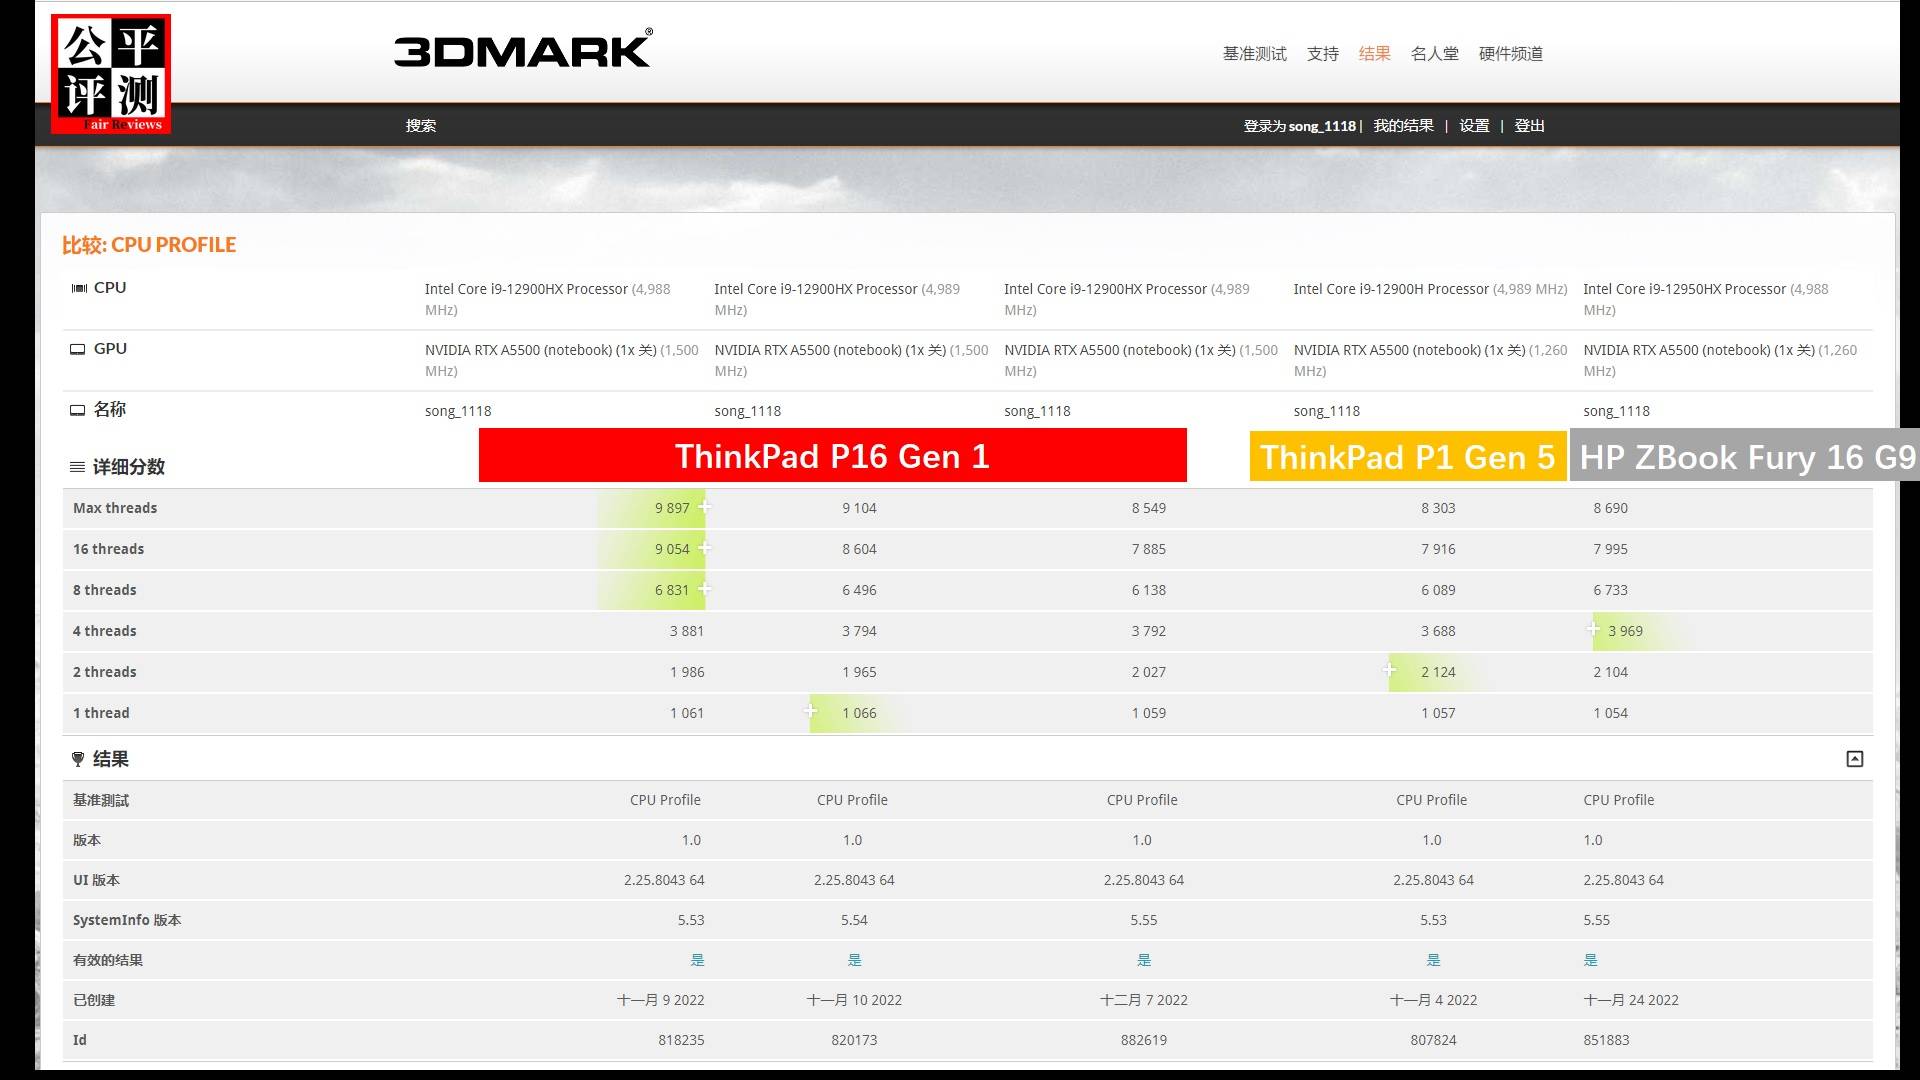
3DMark CPU Profile
After getting the P16G1 on November 8, its BIOS has been upgraded from 1.13, 1.14, 1.15, and the author has obviously found that the performance of its CPU has also changed significantly---- getting lower and lower: by the time of version 1.15, its 3DMark CPU Profile has gone from far ahead at the beginning, to be lower than HP ZBook Fury 16 G9, only higher than ThinkPad P1 Gen 5...
Post your Opinion